Overview
This note presents some initial cell learning results using the rewired “Gal-His” yeast previously constructed. In a variety of conditions, we can observe adaptation of the rewired strain. When grown in galactose without leucine or histidine, the strain grows well, using galactose as its carbon source and making histidine using the His3 enzyme transcribed from the Gal1/10 promoter as well as leucine from the Leu2 gene transcribed from its native Leu2 promoter. In addition the Gal promoter also drives expression of the green fluorescent protein (GFP). In galactose the yeast exhibit green fluorescence (with blue illumination). Adaptation has been shown in two different types of assays. Cells grown in liquid culture assay show a characteristic “double-logistic” growth curve when switched from galactose to glucose media without histidine or leucine (+gal-his-leu). We observe this phenomena in cultures grown in both the v1 version of hte bioreactor and the v2 version. Before adaptation, cells strongly express genes from the Gal promoter, as observed by strong GFP fluorescence. A few hours after switching into glucose, expression is undetectable by GFP fluorescence. After adaptation, low levels of promoter activity can be detected, but not comparable to the levels under galactose induction. In addition to the liquid culture assays, colonies were grown on plates and time-lapse photo micrographs were recorded. These show the adaptation process as colonies initially repress the promoter, showing low GFP fluorescence, but later adapt and are able to de-repress the gal promoter in glucose conditions.
Background
Recall from the previous note that we have rewired the genome of the w303 strain of Saccharomyces cerevisiae, which is unable to make its own Histidine, Leucine, Uracil, or Tryptophan (Genotype MATa/MATα {leu2-3,112 trp1-1 can1-100 ura3-1 ade2-1 his3-11,15} [phi+]). We have placed the gene His3 under the control of the bi-directional Gal1/10 promoter in the pESC-LEU plasmid, with a GFP gee also under the control of this promoter. This, when the promoter is activated (canonically in the presence of the sugar galactose), the promoter is activated and the His3 and GFP genes are transcribed (and presumably translated). The pESC-Leu plasmid which contains the rewiring construct replicates using the \(2-\mu\) origin, giving it an average of 40-60 copies per haploid cell (although this depends on growth conditions and the selectable markers used). The Gal1/10 promoter is primarily controlled by the Gal4p and Gal80p proteins1. When galactose is not present, Gal80p binds Gal4p, leading to formation of a protein complex which sequesters Gal4p and switches off expression from GAL promoters. In the presence of galactose, Gal3p binds to Gal80p, freeing it from Gal4p and activating GAL promoter genes.
Results
“Double-Logistic” Growth in Liquid Culture
When grown in the galactose, the Gal promoter is active, transcribing and expressing both His3 and GFP. When cells are diluted in to glucose media, the presence of glucose strongly represses expression from the Gal promoter. At this time, no new HIS3 or GFP mRNAs are produced. Existing mRNAs can still be translated, however mRNAs in the yeast cell have an average half-life of 22 minutes [1]. The median half-life of proteins is about 8.8 hours [2], but without new synthesis, proteins are also diluted out during cell division2. After transfer to Glucose, cells are able to maintain growth using existing stores of histidine and existing HIS3 protein until stores are exhausted by dilution from growth and degradation. At this time, growth stops, however, after a period of time, cultures are able to adapt to this new condition and resume growth. This results in a characteristic “double-logistic” growth curve. This is consistent with three-phase growth of colonies observed on plates in [3] and in liquid culture in [4]. I carried out a series of experiments putting rewired yeast that had never been adapted to glucose before (“naive rewired”) cells into media without histidine and leucine and 2% glucose (-his -leu +glu). Experiments on 2 different days were carried out in this way, and in between, an experiment growing naive-rewired cells in minimal media (-his -leu +gal), which did not show the characteristic double logistic behavior. These experiments were done in the V1 bioreactor with Formedium’s complete supplement mixture DCS0469 without histidine and leucine. This media is not exactly what Braun et al. [4,5], so I carried out a second experiment using the media they did, recreating it from Formedium’s Kaiser synthetic complete media DSCK1027 without histidine, leucine, tryptophan, or uracil and adding 6mg/l trp and 3mg/l uracil.
Code
using CSV
using DataFrames
using Plots
using HTTP

url_base = "https://raw.githubusercontent.com/livingphysics/RPi-Biosensor/refs/heads/main/data/"
file_names = ["250827_yeast_galhis_csm-his-leu-glu.csv", "250829_naive_galhis_csm-his-leu-gal.csv", "250901_naive_galhis_csm-his-leu-glu.csv"]
plots_array = []
for k in 1:3
    response = HTTP.get(url_base * file_names[k])
    data = CSV.read(response.body, DataFrame)

    # Get elapsed time in hours
    t_run = data.elapsed ./ 3600

    # Extract OD columns (columns 2-5)
    OD = [data[:, i+1] for i in 1:4]

    # Find maximum OD value
    od_max = maximum(maximum.(OD))
    OD_f = 0

    # Create subplot
    p = plot()
    t_mid = zeros(4)

    for i in 1:4
        # Normalize OD
        norm_od = (od_max .- OD[i]) ./ (od_max - OD_f)

        plot!(p, t_run, norm_od,
            linestyle=:dash,
            label="OD $i")
    end

    # Set plot properties
    title_text = if k == 2
        "2% Galactose"
    elseif k == 1
        "2% Glucose Run 1"
    else
        "2% Glucose Run 2"
    end

    plot!(p,
        title=title_text,
        xlabel="time (h)",
        ylabel="Relative OD",
        xlims=(0, 50),
        guidefontsize=12,
        titlefontsize=12,
        legendfontsize=10,
        framestyle=:box)

    push!(plots_array, p)
end

# Combine all subplots
final_plot = plot(plots_array...,
    layout=(3, 1),
    size=(800, 900),
    theme=:dark)

savefig(final_plot, "thumbnail.png")
display(final_plot)
GKS: cannot open display - headless operation mode active
Code
using CSV
using DataFrames
using Plots
using HTTP

url_base = "https://raw.githubusercontent.com/livingphysics/Bioreactor_v2/refs/heads/main/bioreactor_data/"
file_names = ["20250901_131355_bioreactor_data.csv"]
plots_array = []
for k in 1
    response = HTTP.get(url_base * file_names[k])
    data = CSV.read(response.body, DataFrame)

    # Get elapsed time in hours
    t_run = data.time ./ 3600

    # Extract OD colums (columns 2-5)
    OD = [data[:, i+5] for i in 1:4]

    # Find maximum OD value
    od_max = maximum(maximum.(OD))
    OD_f = 0

    # Create subplot
    p = plot()
    t_mid = zeros(4)

    for i in 1:4
        # Normalize OD
        norm_od = (od_max .- OD[i]) ./ (od_max - OD_f)

        plot!(p, t_run, norm_od,
            linestyle=:dash,
            label="OD $i")
    end
    plot!(p,
        title="2% Glucose",
        xlabel="time (h)",
        ylabel="Relative OD",
        xlims=(0, 90),
        guidefontsize=12,
        titlefontsize=12,
        legendfontsize=10,
        framestyle=:box)

    push!(plots_array, p)
end

# Combine all subplots
final_plot = plot(plots_array...,
    layout=(2, 1),
    size=(800, 300),
    theme=:dark)

display(final_plot)
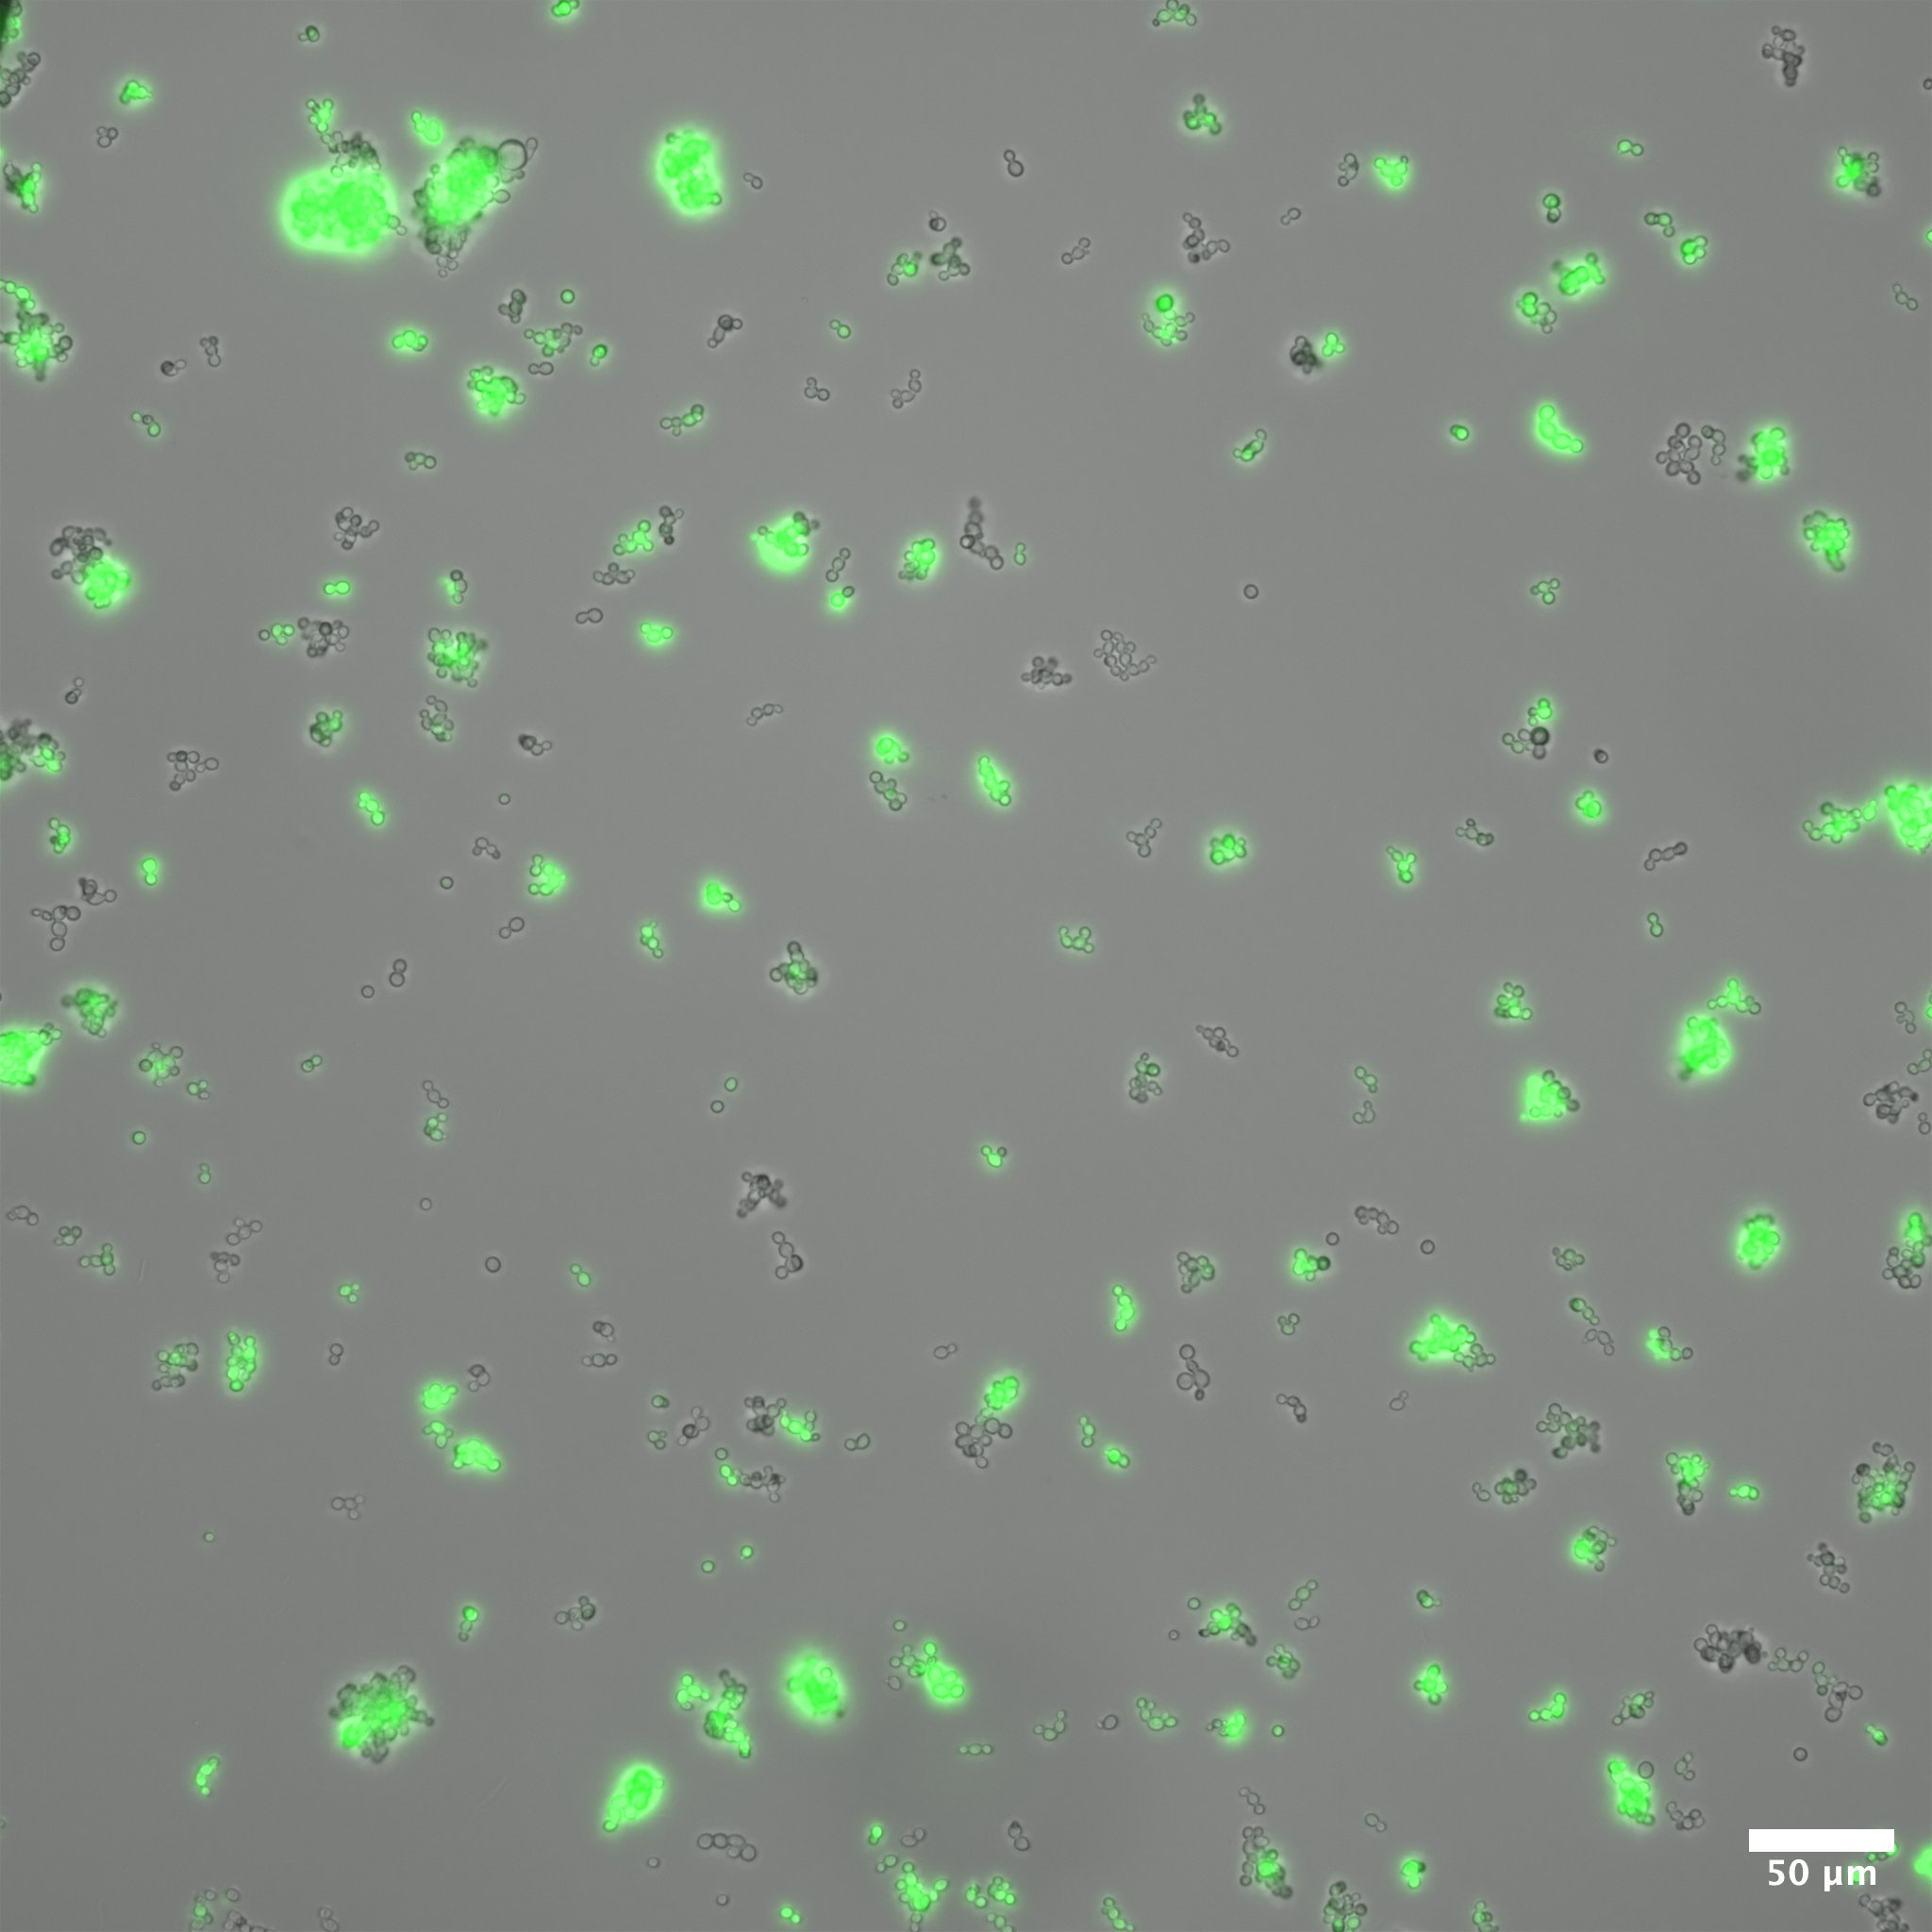
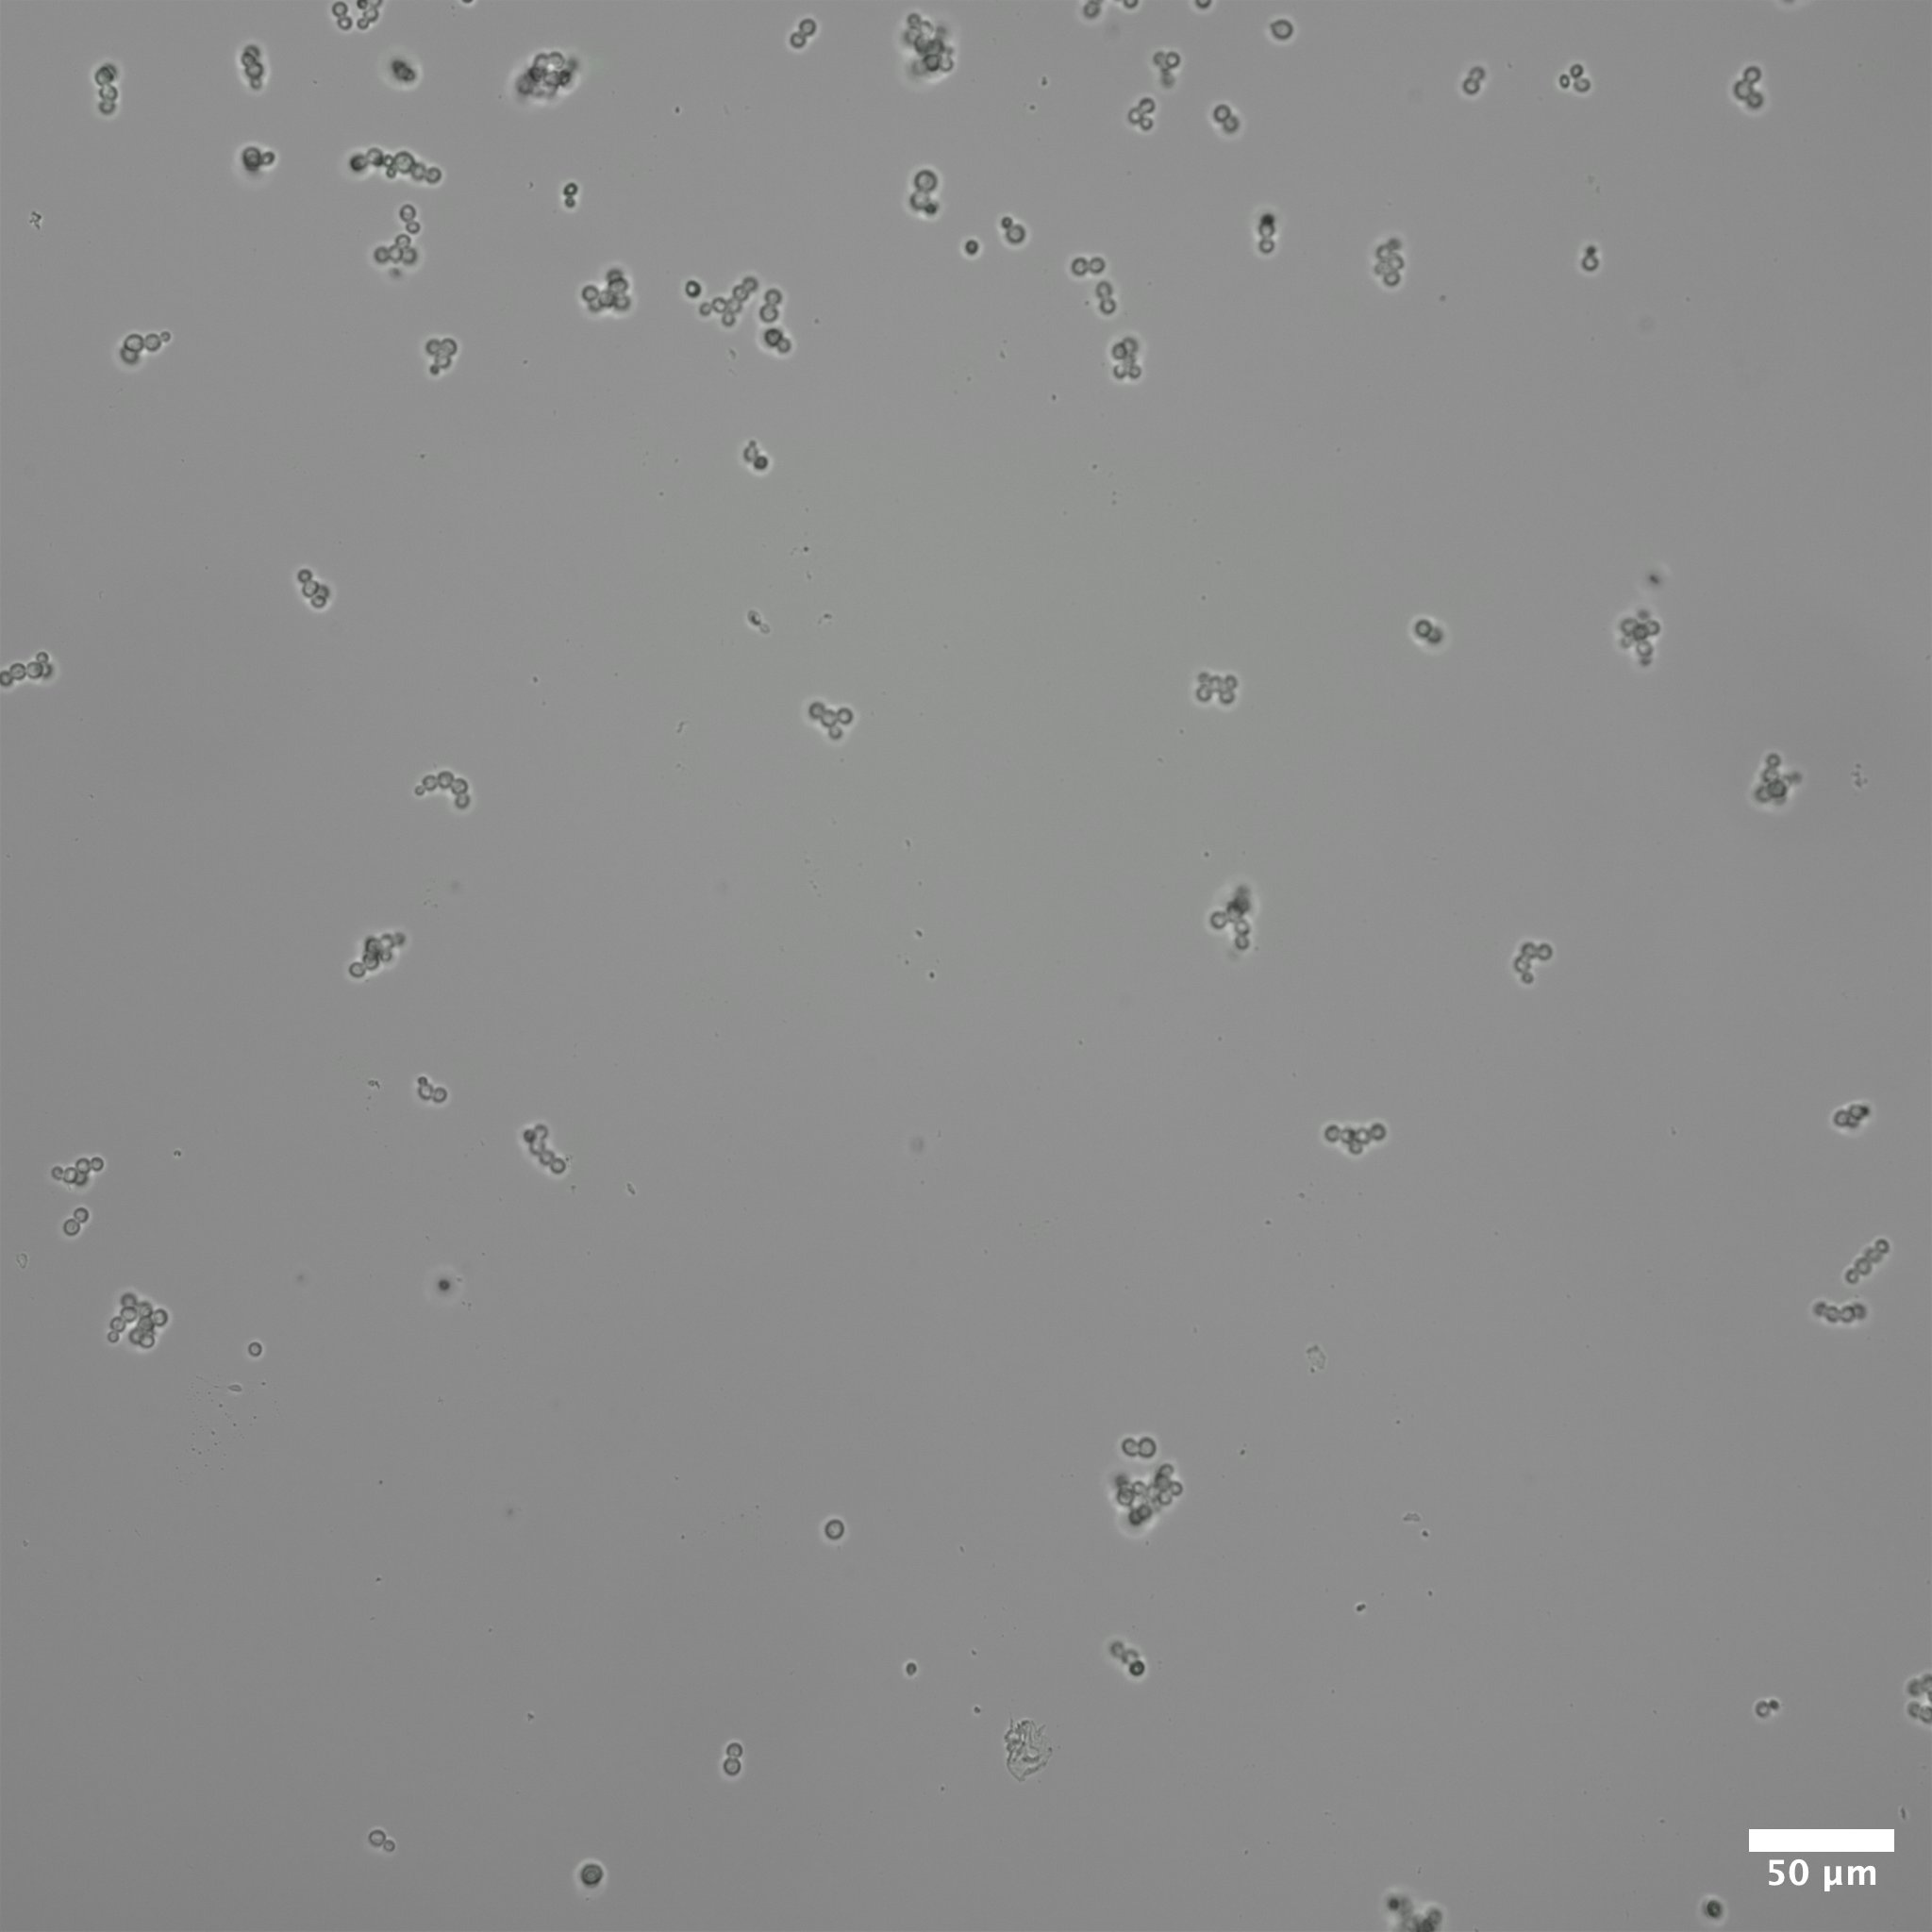
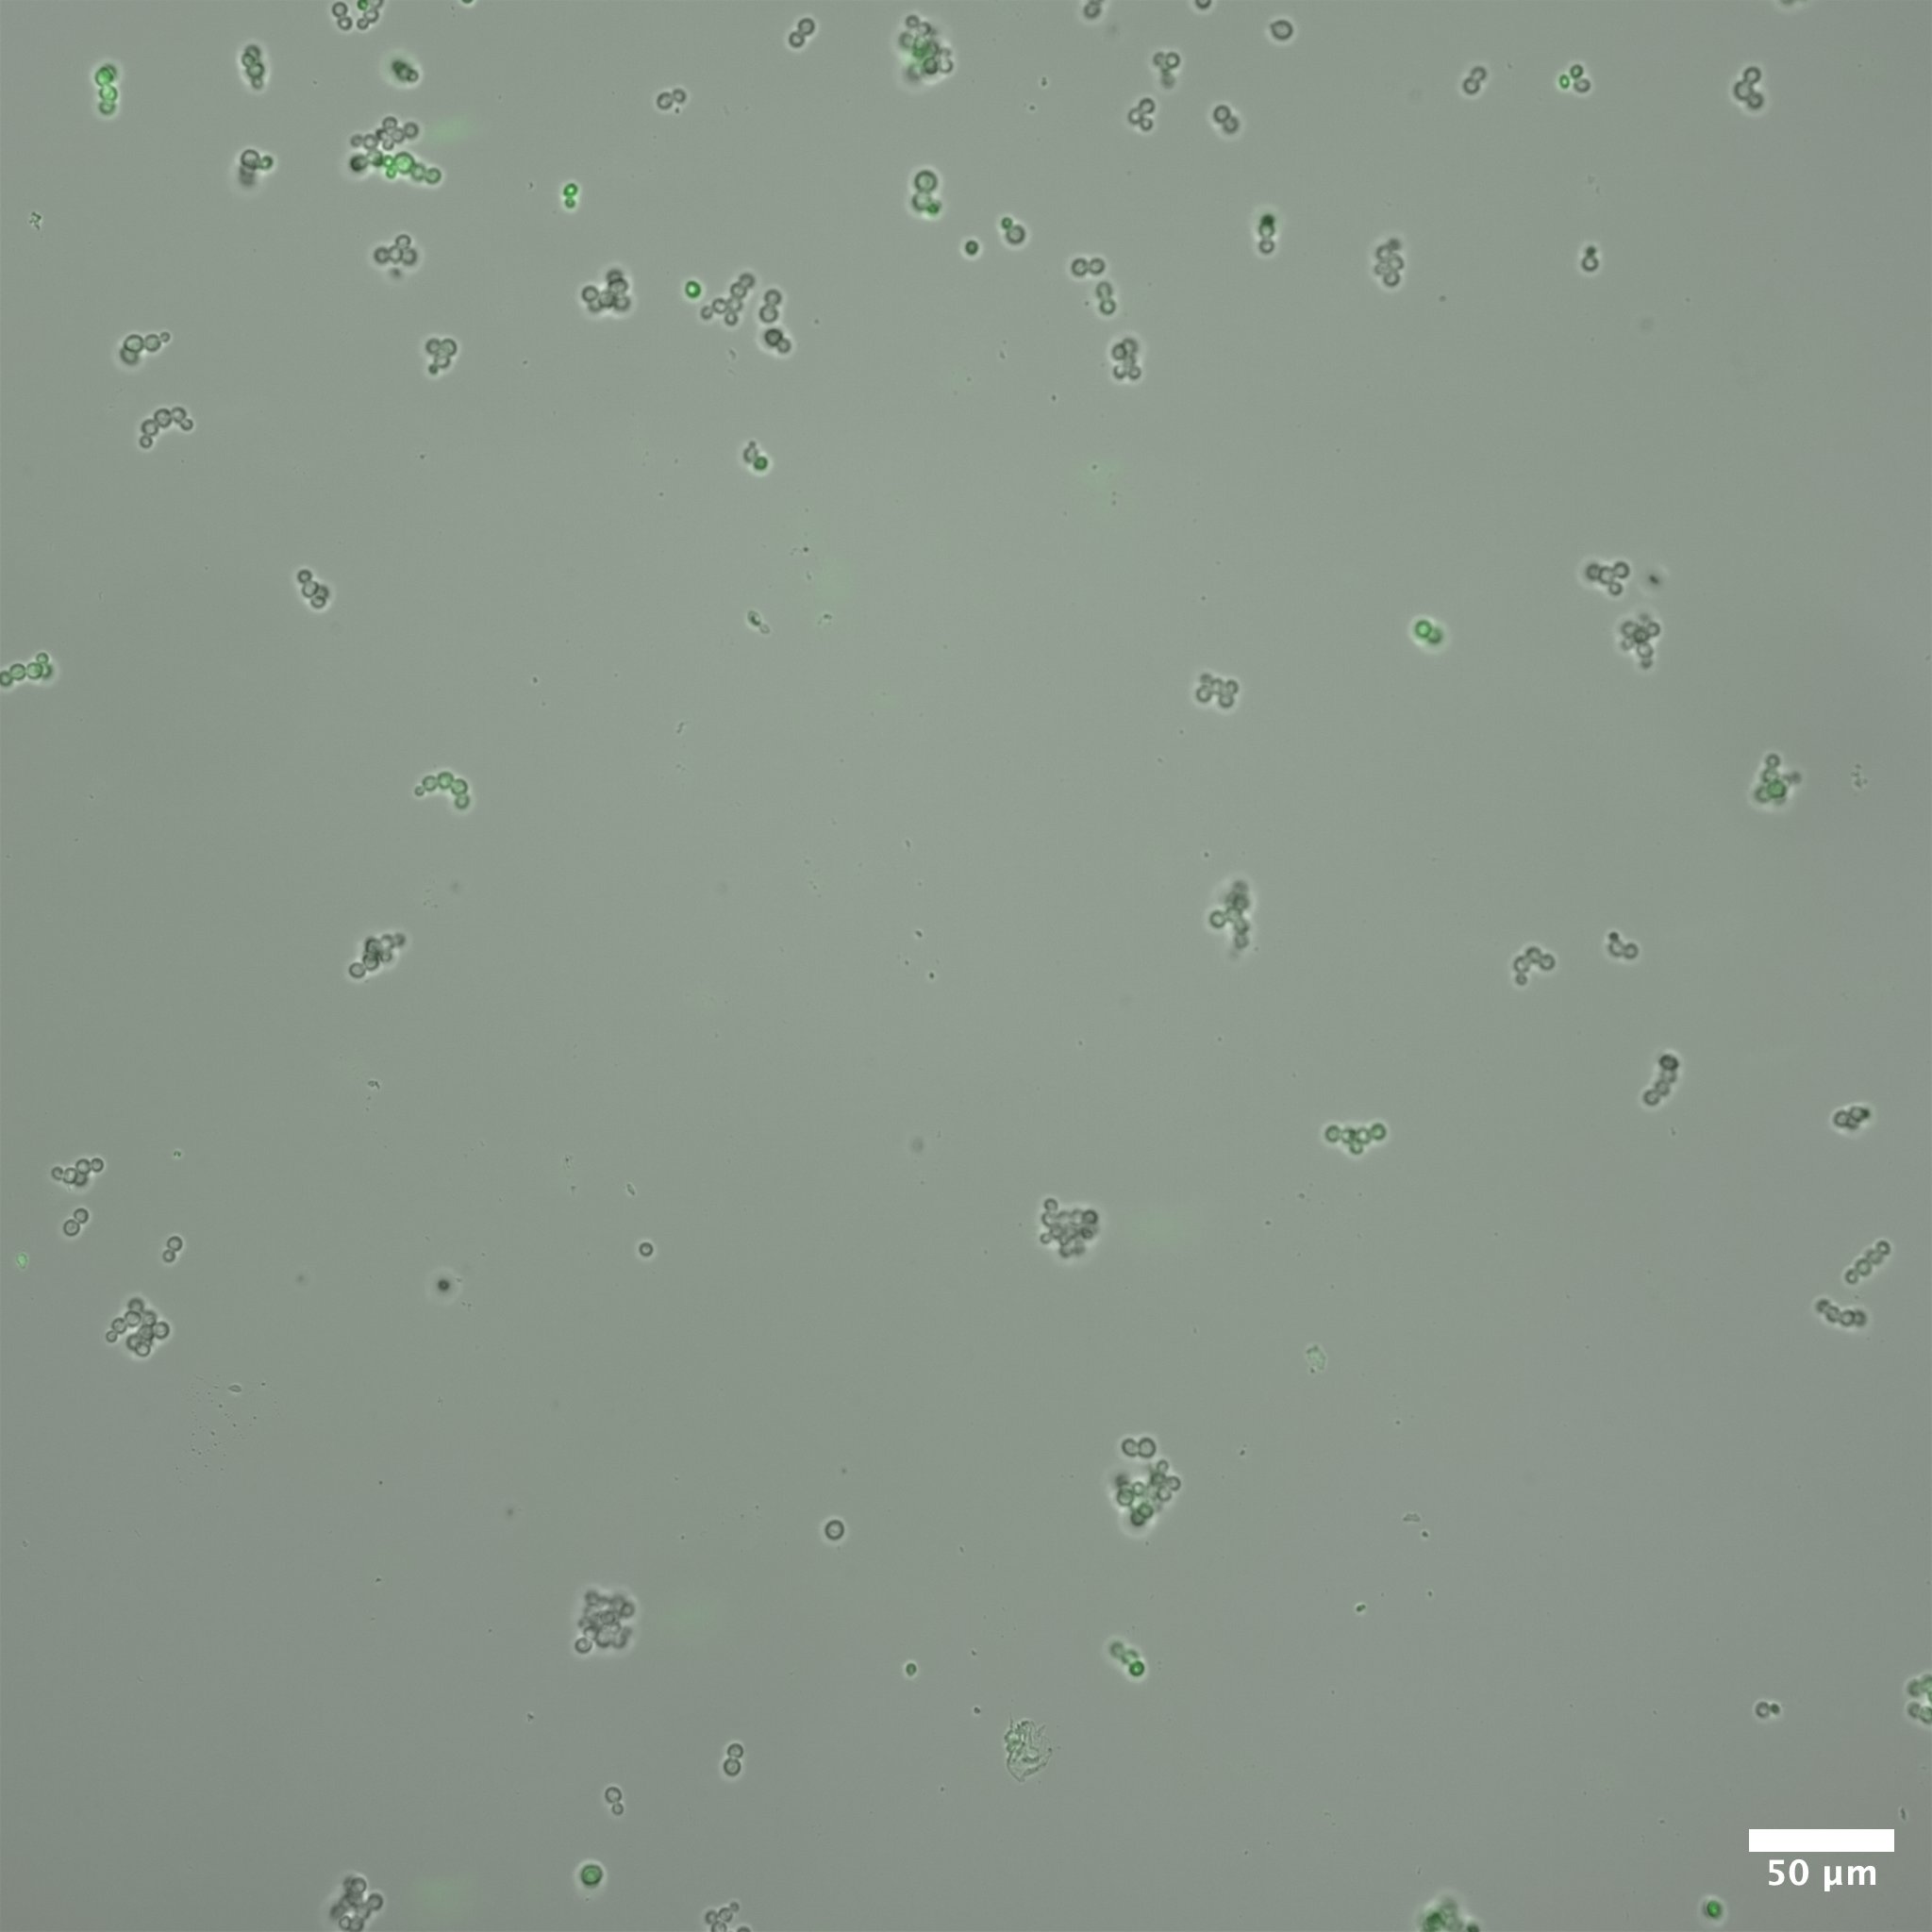
Before adaptation rewired yeast were grown in galactose media. In this condition we expect that the gal promoter will be activated, expressing both GFP and HIS3. In this case, we expect that the cells will glow brightly green when excited with blue light. Figure 3 shows rewired cells pre and post adaptation. Expression from the Gal promoter (as visualized by GFP expression) is very strong prior to the switch to glucose. After adaptation, expression is much less (but not completely absent). At the same exposure (0.5 seconds) it is difficult to see the fluorescent signal, but at longer exposure some fluorescence is visible.
Colony Growth on Plates
Liquid culture is convenient for measuring the growth dynamics using continuous optical density measurements, however, liquid cultures generally start from tens of thousands of cells, and it is difficult to quantify pre-existing population variation that may influence the subsequent dynamics of adaptation. In contrast, growing colonies on plates allow the observation of the populations that start from single cells but is more inconvenient, as special care must be taken to ensure time-lapse images taken over the course of days remain in focus an that the plates do not dry out.
One possibility is that in a large population fo yeast cells, previous cell growth and division has introduced a variety of mutations into the population. This standing genetic variation can then provide a palette from which beneficial mutations can be selected. If this were the case, we would expect a few things.
- That the cells harboring the pre-existing beneficial mutation would have a growth advantage immediately
- That not every cell in the population would harbor the beneficial mutation (in fact only a few) cells should have it.
- The descendants of the original mutant cell would inherit the growth advantage.
These considerations reflect those that Luria and Delbruck [6] put into their arguments which showed that bacteria do not induce adaptive mutations for phage resistance.
In this case, we would expect to see many arrested cells on the plate, and only a few colonies that grow robustly. This is not what we observe. Rather, we see the majority down regulate the Gal promoter and turn off the expression of GFP and HIS3. The colonies continue to grow but GFP fluorescence is absent. At some point during this initial growth phase, some cells withing the colonie figure out how to resume expression from teh Gal locus, re-expressing GFP (and presumably HIS3). When this happens the colony growth rate increases. These are the three phases of growth observed in the previous experiments and correspond to the double logistic growth curves in liquid culture. A more careful analysis of the colony growth rate can be carried out to estimate the average cell division time during the adaptation period. In addition, the optics can be improves to get better resolution data for the re-expression dynamics of the GFP.
References
[1]
L.-L. Chia and C. McLaughlin, The Half-Life of mRNA in Saccharomyces Cerevisiae, Molecular and General Genetics MGG 170, 137 (1979).
[2]
R. Christiano, N. Nagaraj, F. Fröhlich, and T. C. Walther, Global Proteome Turnover Analyses of the Yeasts S. Cerevisiae and S. Pombe, Cell Reports 9, 1959 (2014).
[3]
L. S. Moore, W. Wei, E. Stolovicki, T. Benbenishty, S. Wilkening, L. M. Steinmetz, E. Braun, and L. David, Induced Mutations in Yeast Cell Populations Adapting to an Unforeseen Challenge, PLoS ONE 9, e111133 (2014).
[4]
G. Woronoff, P. Nghe, J. Baudry, L. Boitard, E. Braun, A. D. Griffiths, and J. Bibette, Metabolic Cost of Rapid Adaptation of Single Yeast Cells, Proceedings of the National Academy of Sciences 117, 10660 (2020).
[5]
E. Stolovicki, T. Dror, N. Brenner, and E. Braun, Synthetic Gene Recruitment Reveals Adaptive Reprogramming of Gene Regulation in Yeast, Genetics 173, 75 (2006).
[6]
S. E. Luria and M. Delbrück, Mutations of Bacteria from Virus Sensitivity to Virus Resistance, Genetics 28, 491 (1943).